Sometimes it’s the hardware
In the last few weeks, I was debugging a nasty bug on a hobby project. I needed to work with ~58GB of data generated by the program itself, which made everything quite slow and cumbersome to work with. But this specific piece of code was quite simple and I was able to rule out every possible cause of the bug, so where could the problem be?
(Ok I think you can guess it from the title, but I want to tell you the whole story anyway.)
The bug
Long story short, my program is a Rubik’s cube solver and I need to generate some lookup tables to speed up the solution search. Pretty much a standard IDA* method: the larger the table, the faster the solver.
I am implementing a new kind of tables, and I know how to reliably generate one of around 30MB and one of around 58GB. I can also compute tables of different sizes between those two, but the method I use is experimental and I am not 100% sure the results are correct. But I can also generate the intermediate tables by deriving them from the 58GB one. This method is quite slow and can only work if the user has enough RAM, but it gives me a way to test the correctness of the other method.
The algorithm to derive the smaller tables from the huge one is quite simple, but to my surprise I was getting different results at every run. I thought it must be some kind of undefined behavior, as it often the case with C.
Time to take out my debugging weapons!
The whole arsenal
To have a reasonable chance at uncovering nasty bugs related to undefined behavior, bad memory access, concurrency and other C programming nightmares, I used all of the following:
- All compile-time warnings GCC offers, enabled with
-Wall -Wextra -pedantic. - Sanitizers, in particular the address and undefined sanitizers. The thread sanitizer could not be used with the large 58GB table because it requires much more memory, but in any case this specific computation is not parallelized (yet).
printf()debugging. Not always effective when dealing with undefined behavior, but it never hurts.- GDB.
- Valgrind.
But nothing, my code did not trigger any error with these tools. Of course it could be an error in my logic, but why would I get a different results every time? This just did not make sense.
Sometimes you are not stupid, sometimes the computer is broken
I started thinking that the OS could be doing something wrong. In fact, I noticed that KDE and Firefox occasionally crashed when I used ~60GB of RAM. Maybe the Kernel messed up swapping? And a KDE or Firefox bug related to unusual memory sizes and usage would not be surprising.
So I tried giving a swapoff -a to disable swap, and then run the
program again. And I got inconsistent results and crashes once again.
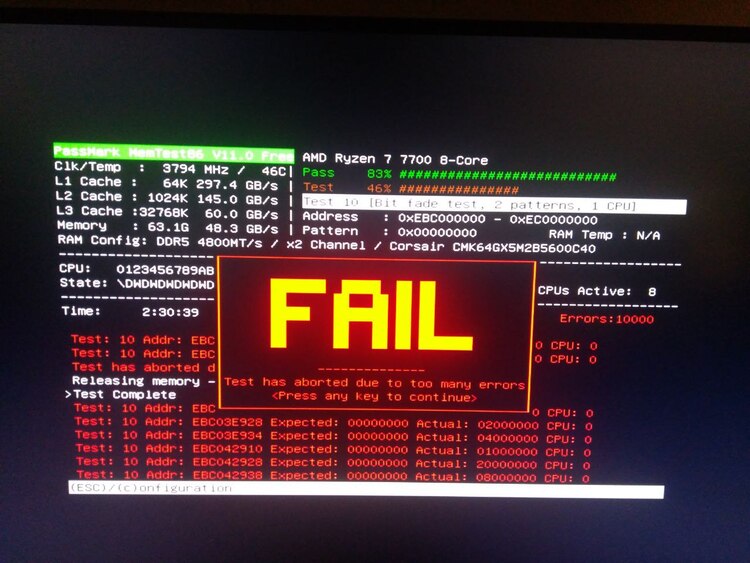
At this point I started doubting my hardware, so I ran memtest86. Sure enough, something was wrong:

By the way, isn’t this screen beautiful? It looks like it comes straight out of an 1980’s hacker movie.
Conclusion
With some more testing I was able to determine that one of the two RAM sticks works fine, and the other one is definitely broken. In case you are curious, memtest86 gives a similar screen with a green PASS message when all tests pass.
Everything is still covered by warranty, so I asked for a replacement. Hopefully I’ll have a working PC with 64GB of RAM again soon, but in the meantime I think I’ll survive with 32GB.
I have been programming for almost 20 years, and this is the first time an error in my program was due to a faulty piece of hardware rather than a bug in my code. Cool :)